Introduction
The performance modeling activity of the Benchmark 4 (BM4) SAIP system had a number of objectives:- To assist in evaluating and selecting candidate architectures and analyzing implementation tradeoffs
- To retire hardware/software design risks associated with the selected COTS DSP architectures
- To develop a virtual prototype which demonstrated overall system operation and identified critical design issues and risk retirement areas
- To develop a combined hardware/software virtual prototype which could be used as a executable specification for future design upgrades
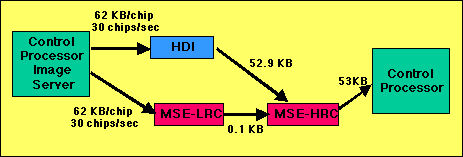
The actual number of image-chips received each second can be variable with an average of 30 chips per second. The incoming image chips are processed by the HDI and MSE-LRC processors. The HDI and MSE-LRC results are sent to the HRC processor for final classification. The MSE-HRC classification results are sent back to the control processor. The number of bytes transferred between the functional blocks is shown for each image chip to be processed. The BM4 system was hosted in a VME chassis. It interfaces to the rest of the SAIP system via an ATM port as shown below. The data rate across the ATM switch was 40 MB/S. The VME bus was a 64-bit data bus. It also ran at a rate of 40 MB/Sec.
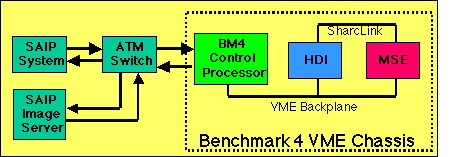
The processing is initiated by the SAIP system when it sends a request to the BM4 control processor to process N image chips. The BM4 control processor then fetches the chips from the Image Server. There is an initial one second delay at the Image Server for the first chip of a scene to be fetched. Thereafter, there is a 10 ms delay for subsequent chips from the same SAR image. The BM4 control processor forwards the image-chips to the HDI and MSE-LRC processors.
The LRC processor compares the image chip to 20 stored template classes. Each class consists of 72 pose angles and the comparison is done for 121 (11x11) pixel offset positions. The target class, pose angle, best offset position of the best five low-resolution matches are sent to the HRC processor.
The HDI processor processes the image-chip and converts it to a high-resolution image-chip that is sent to the HRC processor. The HRC processor uses the results from the LRC processor to perform classification on the high-resolution data from the HDI processor against the five best high-resolution template classes. The MSE-HRC processing is done on 14 pose angles of each class and at 49 (7x7) pixel offset locations.
Both the HDI high resolution image-chip and the target class, pose angle, offset location and classification scores for the five best matches are sent to the BM4 control processor.
When the BM4 control processor has collected the processing results for all the image chips in a single SAR scene, it sends the results back to the SAIP system. The SAIP system may have already initiated requests for processing of image-chips for other SAR images. The frequency of the processing requests and the number of image-chips per scene varies, but the average rate of incoming image-chips is 30 per second.
Overview of the Cosmos BM4 System Level Performance Modeling
Omniview's Cosmos performance modeling tools were initially selected to develop the SAIP MB4 system model. Cosmos combines a set of tools that are integrated into a single GUI. The tools generated VHDL code from graphical hardware and software models that are compiled and executed using a VHDL simulator such as Mentor's QuickVHDL. The events of the simulation are stored in a file and can be displayed in a number of forms by Cosmos post simulation analysis tools.
First the BM4 hardware architecture was created using Cosmos' Hardware Design tool. The design was developed in a top-down hierarchical manner with each block containing lower level blocks. The lowest level blocks in the design consisted of the components selected from the Cosmos library (e.g. processors, network elements). The blocks or components were interconnected via ports and signals, similar to a hardware schematic capture tool.
The results of the more detailed board level VHDL models (see MSE/MAD Classifier FPGA Custom Board Performance Modeling and/or MSE Classifier C80 and C6201 Performance Modeling sections) were used to develop simplistic models for the custom boards. System models were developed using different configurations of the MSE and HDI processing functions, based on the C60, C80 and Sharc board architectures. System simulations for each configuration established that the total VME bus utilization, without a dedicated high speed interconnect network between the HDI and MSE boards, was less than 20%. This conclusion eliminated the requirement for a dedicated Raceway port between the HDI and MSE processors.
When the tradeoff decision was made to use the Alex Sharc boards for both HDI and MSE processing, uncertainty arose about the partitioning of the HDI, LRC and HRC processes across the multiple boards. There were also questions about what constraints, if any would be associated with the Sharc link port communication network. A detailed model of the Sharc processor, including communication between the link ports, was needed as part of the system simulation. The Cosmos tool was again used to model the Alex Sharc board system.
The software architecture was captured using Cosmos' Software Design tool. The software tasks were developed by describing top level data flow graphs and other control signals required for communication between the processing tasks. The tasks were captured as task blocks and interconnected via message queues. Each software task was hierarchically described. Task blocks at the lowest level consisted of flow graphs describing the software behavior. The flow graphs were developed using process blocks and decision blocks. The process blocks consisted of predefined instructions (VHDL coded functions) such as execute (compute delay), variable operations and messaging. The process blocks also contained custom VHDL code. Coding in VHDL was necessary for the more complex tasks, that require detailed descriptions or got unwieldy when defined by Cosmos' instructions and decision blocks. In general, separate tasks are needed for each processor at the lowest level. Even when tasks were the same, the messaging between processors was unique. The software task scheduling was explicitly controlled by the flow graph assigned to the control processor for handling the messages between the processing tasks.
The mapping of the software tasks to the hardware architecture was done using Cosmos' Mapping tool. This step was straight forward and easily accomplished by manually assigning the tasks to the processors. This step completed the Cosmos model development process.
Cosmos automatically generated the VHDL code using the Generate VHDL tool. The tool created the routing file and VGDL code for the individual models in a model sub directory. To compile and run the VHDL code, we ran the 'make' file tools to automatically compile the VHDL files and activate the QuickVHDL simulator. In the simulator, we specified the time we wanted the simulation to run. When the simulation ended, the simulator generated a 'transcript' file that contained all the pertinent simulation event data for post processing analysis. The simulation results were displayed by selecting the Cosmos Analysis tool, loading in the transcript file and displaying the activity timeline for analysis.
The detailed Cosmos hardware and software models and the final simulation results are described in the following paragraphs.
Cosmos Hardware Architecture Models
As shown in Figure 2, the Cosmos top level BM4 system hardware model was the same for all the candidate architecture configurations.
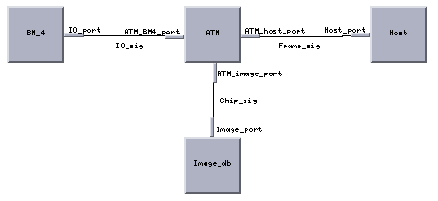
It consisted of the BM4 block that represents the SAIP VME chassis and the SAIP system external components, i.e., the ATM switch, the SAIP Control Processor ("Host") and the Image Server. The different system options and configurations varied based on the BM4 block. The different BM4 architectures modeled are shown in the following options tree:
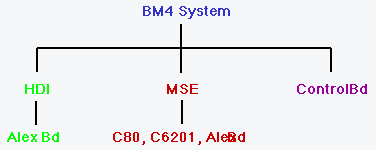
For the Alex all COTS design the individual processors were connected via the link ports and can be group in separate partitions. In this configuration, the Alex boards were not partitioned along functional blocks. Each board contained different processing functions.
The Cosmos hardware diagram the BM4 subsystem are shown in Figure 5. Figures 6, 7, and 8 show the Cosmos hardware diagrams for the simplified C80, C60 and Alex boards, respectively.

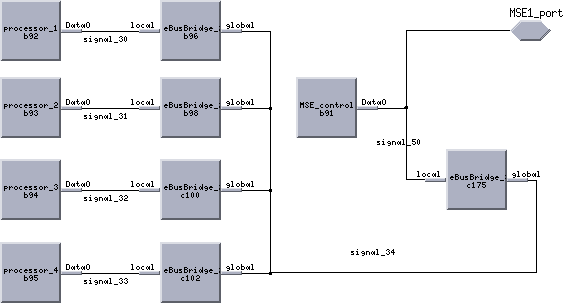
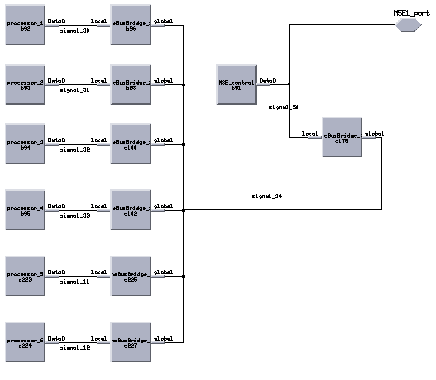
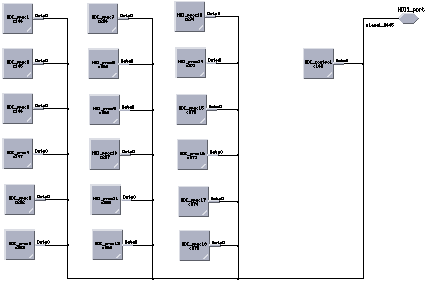
Figure 9 shows the Cosmos hardware diagram of the Alex 2 board system hardware model. A detailed diagram of the Alex board model is shown in Figure 10. It portrays the actual physical partitioning of the board with two Sharcpacs and two root Sharc processors. Figure 11, shows the physical connections of the 8 Sharcs within an individual Sharcpac. Finally, figure 12 shows the hardware diagram of the Sharc DSP model with its 6 link ports. The Sharc was modeled as a processor with 6 VME bridge components having link port transfer rates of 40 MB/S. The Alex board hardware diagrams were developed to accurately represent the actual Alex Sharc DSP board topology.
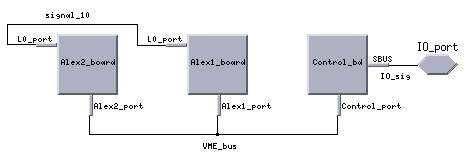
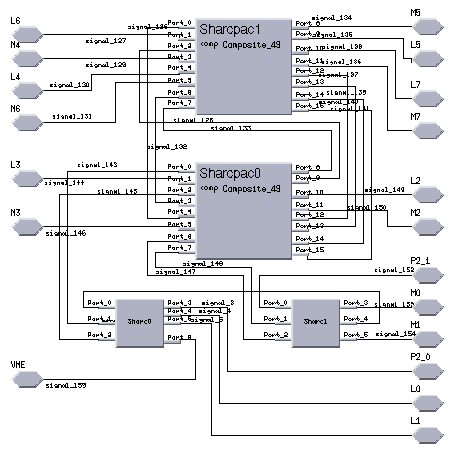
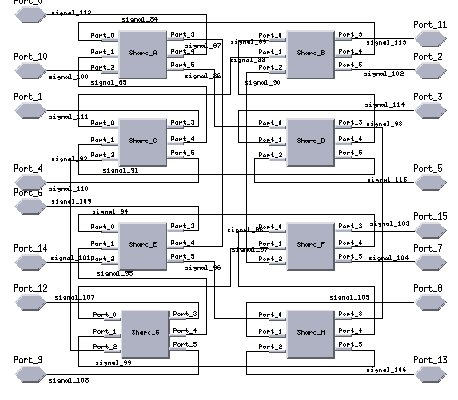
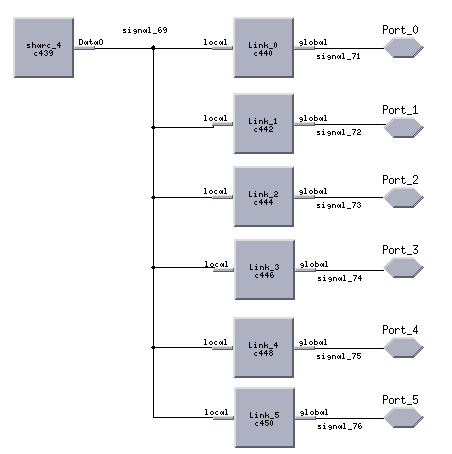
Figure 13 shows the Cosmos top level software architecture model for the SAIP system with separate MSE and HDI functional partitions. As shown, the Host task sends a Frame_req message to the Control task. The Control task then sends a Chip_req message to the Image_server task and receives the Chip_data message. The Control task then sends Chip_data messages to both the HDI task and MSE task. The HDI task sends the processed high resolution chip data (the HR_data message) to both the MSE task and the Control task. The MSE task, which performs classification on both the low resolution chip data and high resolution data sends the classification results back to the Control task. When the Control task has accumulated reports for all the image chips specified in the Frame_req message, it sends a combined report back to the Host. This cycle completes the processing for a sing frame message.
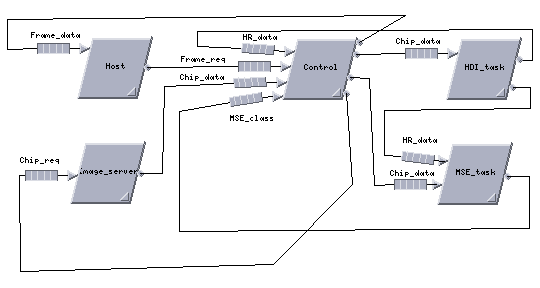
The Control, Host and Image_server tasks were defined as Cosmos flowcharts. The Host and Image_server tasks are simple flowcharts. The Control task flowchart is more complicated, being the center of message activity for handling and dispatching image chip data.
The HDI and MSE tasks were built as hierarchical tasks and repeated for the specific board being modeled. For example, Figure 14 shows the task graph for a C80 based MSE board having a separate task for each of the four C80's on-board and a local control task represented by MSE1_input which maps onto the local board control processor. Each of these tasks was defined by a flowchart. The C80 processing tasks were relatively simple while the MSE1_input task was more complex since it handled the dynamic scheduling of the tasks for both the low and high resolution chips. For the C80 implementation, each C80 could process either chip type.
For the Alex DSP system that combined the processing functions on the same board or boards, the top level system software task diagram is shown in Figure 15. The MSE and HDI functions were replaced by the Alex task. Since all the Alex boards were physically the same, one control processor (the root Sharc) handles the dispatching of chips uniformly to all other Sharcs via the link ports, and there was no need to partition the software tasks along board boundaries. Instead, the lower data flow graph consisted of a root task and the functional tasks (HDI, LRC, and HRC) were statically mapped to individual Sharc processors.

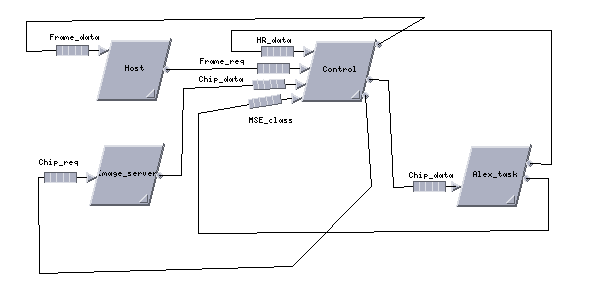
Defining the Sharc DMA data transfer behavior created a challenge. The transfers are done point-to-point between Sharc links. The Sharc processors are interrupted to handle message forwarding to the next port. This behavior was elegantly handled in Cosmos by assigning two tasks to each Sharc processor: a processing task and a routing task. The routing task was assigned a higher priority. If the routing task received a message while the Sharc was in the middle of executing the processing task, the Sharc switched to the routing task to forward the message. This was our first attempt to model the Sharcs link port behavior. The software model for the board, however, became very complex and rigid. The routing task of each Sharc had to be because of its unique network address and the type of message. The software tasks for this Alex board model are shown in Figure 16. The software tasks were mapped onto 9 HDI Sharcs, 6 LRC Sharcs and 1 HRC Sharc. Mapping the processing functions to different Sharcs required modification of the message links and the routing tasks for each processor task.
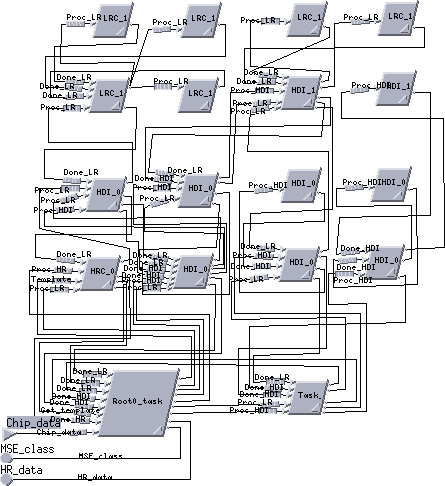
A simulation of the Alex board model was run and the results showed that the routing of the messages across the link ports did not add significantly to the processing task overhead. Most link port transfers accounted for less than 1% of the total processing time. The overhead required for handling the transfers was even less. As a result, the Cosmos software model was simplified by ignoring the processor overhead for handling the messages. The revised software task topology is shown in Figure 17. This model was much simpler and more easily reconfigurable than the previous model. The same simulation and mapping was run on the simplified model. The execution timelines for both models looked virtually the same.
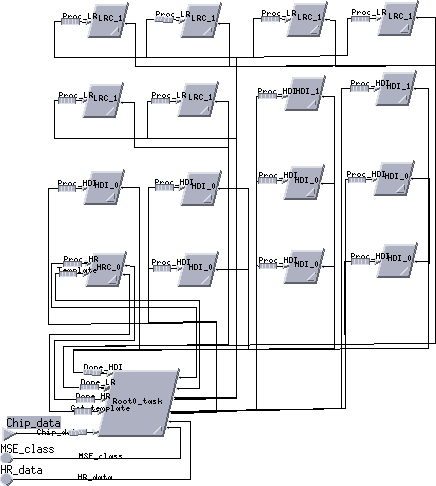
The Alex board model was then extended to two boards. The software task diagram was extended to include additional HDI, LRC and HRC tasks, as shown in Figure 18. The SAIP application was mapped to 22 processors that represented one third of the total processors on the BM4 four board system. The mapping corresponded to the GEDAE DFG mapping for the actual Alex boards. The application was mapped onto 12 HDI Sharcs, 8 LRC Sharcs and 2 HRC Sharcs and a simulation was run. The results showed the processors ran at a sustained rate of approximately 10 chips per second. The compute time behavior used for each task were 1.2 seconds for HDI, 190 ms for each one of four concurrent LRC tasks and 134 ms for each HRC task.
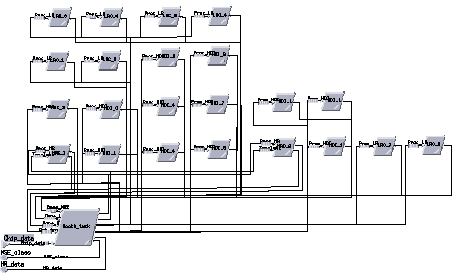
Figure 19 shows the Cosmos timeline for a 20 second simulation for the Alex two board system. The processor utilization is shown on the right, which includes latency for starting the processors as well as idle time at the end of the simulation. The limiting task in the timeline was the HDI processing. With 12 HDI processors running, each processing a chip for 1.2 seconds, the theoretical limit with 100% utilization was to process 10 chips per second
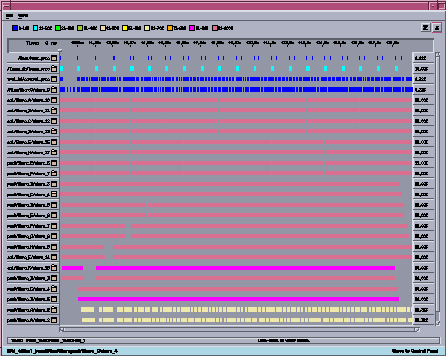
The Alex two board simulation provided realistic timing results but took 10 hours to run. It would have been futile to try to expand the model to the full BM4 system four board architecture. Even using the simple Sharc model without the link ports, the system crashed when trying to use more than two boards. Meanwhile, an approach had been devised to model the Sharc link transfers using lightweight VHDL models that would allow the full system to be modeled.
Modeling the system in PMW/Cosmos proved useful in retiring a number of concerns by demonstrating the:
- VME bus utilization at is relatively low (20%) eliminating the need for a dedicated port between the HDI and MSE functions.
- Sharc link port overhead was extremely low and did not impact communication between processors.
- Processor interaction in the routing of messages through multiple nodes did not degrade image chip processing performance.
- Mixing HDI, LRC and HRC processors on a board or across multiple boards was an efficient solution for balancing the processing load
- A single processor could be used as the central controller for all Sharc processors and the sole interface with the control processor.
- The largest data transfers occurred between the root and HRC Sharcs to pass the high resolution template data. (The model did not overlap template data transfers with HRC processing and consumed 5% of the task time.)
Performance modeling of complex processing systems may be accomplished using lightweight token based VHDL library models. Each new system may require custom processor or network elements. Rather than completely recoding the required VHDL processor or network models, it is usually simpler to use existing library components and modify them. Although a VHDL system level performance model can be coded top-down, it is usually easier to develop it bottom-up by first defining and developing the leaf level models.
The first step in developing a performance model is to defined the components needed. Once the individual leaf level models are identified, existing processor and network models can be investigated to identify models with similar behavior (VHDL code). The required processor and networks models can be implemented by customizing the existing VHDL code. At the leaf level, the code is behavioral in nature with the emphasis on the token level timing behavior of the component and the messaging protocol at the network interfaces. A VHDL testbench must be develop to verify that the customized module operates as expected.
Once the leaf modules have been coded and tested, the higher level structural VHDL models are created by interconnecting the components into the desired topology. The structural models should portray the physical topology and module hierarchy of the real system; for instance, a MCM module level, a daughter board module level, a board level or a chassis level.
It is usually convenient to develop testbenches at each level to test the interaction of the processors, the local network, and the module's interfaces to higher levels.
Once the submodels have been tested, a top level model can be assembled and tested. The testbench normally consists of mapping the application software model to the hardware architecture and simulating it.
VHDL processor models require processor routing files that define the routing paths they need to get to other devices. Each processor also needs a program file that contains the instructions defining its behavior. This program consists of a unique sequence of a small set of instructions that define computation times and the sending and receiving of messages. To facilitate the generation of these files ATL has developed a set of tools to map the application to the hardware architecture.
The tools consist of two GUIs. One is an architecture GUI that allows the hardware architecture to be built graphically. It is similar to the Cosmos Hardware Design tool, except that the leaf level components are custom lightweight VHDL library components. The routing tool uses the architecture to generate the routing files for all processors.
Another tool is a data-flow-graph (DFG) GUI that allows one to graphically capture the software data flow model of the application and map each function to processors in the architecture graph. Processing times for each function are defined at each node. Connections between nodes are represented by data flow, with the amount of data transferred defined for each connection. A scheduling tool uses the software data flow model to statically schedule the tasks and automatically generates the program files for each processor. This tool makes the software generation very simple.
With the program and routing files in place, the QuickVHDL simulation is run for a specified time. To analyze results, the VHDL models must contain code for recording the beginning and/or end times of events. For example, the beginning and end of the processor compute times should be written to a file during the simulation. Post processing tools use this timing file to display the recorded events for analysis.
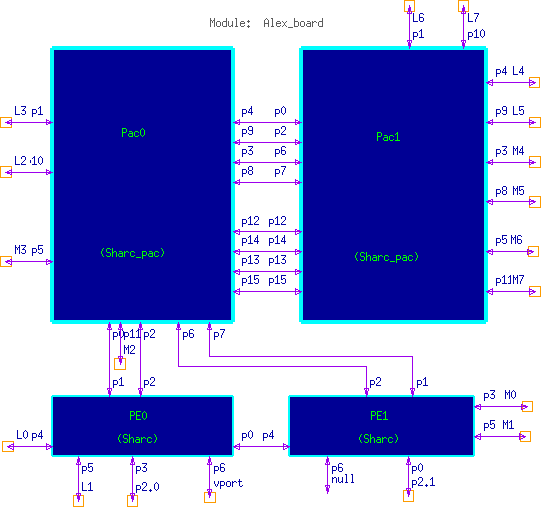
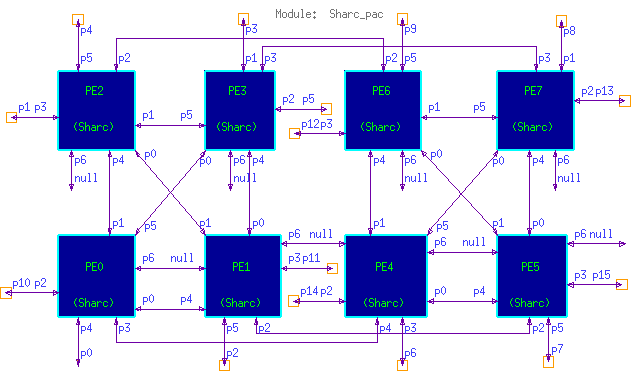
Once the Sharc VHDL model was developed and tested, an Alex board structural model was developed consisting of two Sharcpacs (each containing eight Sharcs) and two root Sharcs corresponding to the actual board. A testbench was developed for the board model by adding the existing Bma4 control processor to drive the simulation. The program and routing files were generated and mapped to 9 HDI Sharcs, 6 LRC Sharcs and one HRC Sharc, in the same manner as the Cosmos single Alex board model.
The system and testbench was then expanded for two Alex boards. This time, the application was mapped and simulated on 12 HDI, 8 LRC and 2 HDI Sharc processors, exactly as was done with the Cosmos two board model.
Finally, the BM4 system model was built with all four Alex boards and the application mapped onto 36 HDI Sharcs, 24 LRC Sharcs and 6 HRC Sharcs. Like the Cosmos model, the execution times for the HDI task was 1.2 seconds, the LRC was 190 ms, and the HRC was 135 ms. The compute times for the LRC and HRC tasks were randomized around the nominal values to evaluate the effect on the overall network efficiency.
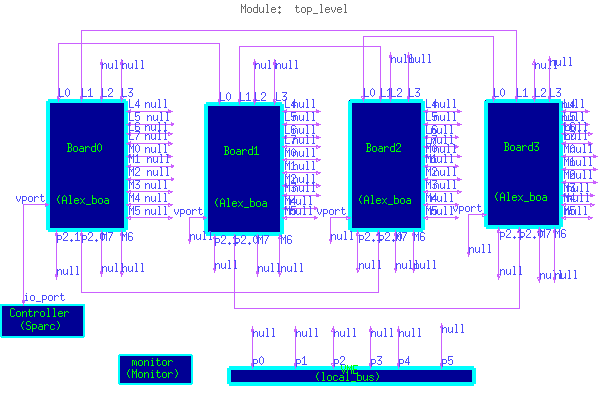
Figure 20 shows the top level topology of the four Alex board model. Figures 21 and 22 show the lower layers in the hierarchy for the Alex board and Sharcpac models respectively.
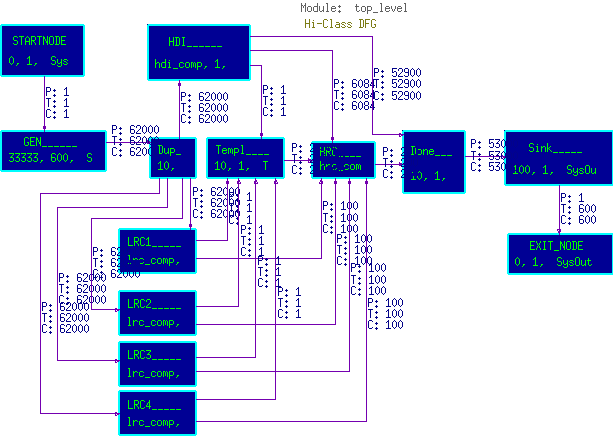
Figure 23 shows the data flow graph for the SAIP application. The figure shows blocks representing task nodes. Inside each task node is its name and three parameters that represent the task execution time, number of times it is to be executed, and the processor group mapping, respectively. The arcs between nodes each have three parameters that specify the amount of data produced by the source, the threshold for triggering the destination and the amount consumed by the destination when it executes. There are three special blocks with reserved names called: STARTNODE, GEN and EXIT_NODE.
The system began with the STARTNODE that executes once. It triggered the GEN node that executed 600 times every 33.3 ms and sent data messages of 62000 bytes each time to the Dup node. This represented the generation of 600 image chips at 30 chips per second for a period of 20 seconds. The GEN node was mapped onto the control processor. The Dup node, which was mapped onto the root Sharc, sent a copy of the chip data to both the HDI and LRC tasks. Since the low resolution templates were distributed across groups of four Sharcs, the LRC task was duplicated four times to model the concurrent processing for the same image-chip,. Each time the HDI and LRC tasks completed a chip, they triggered the HRC task to start processing, At the same time the Templ node sent the HRC template data to the HRC node. When the HRC task completed, it sent the classification results to the root Sharc that also received the high resolution image from the HRC node. The combined processing results were sent back to the control processor. The simulation ended when all 600 image chips have been processed.
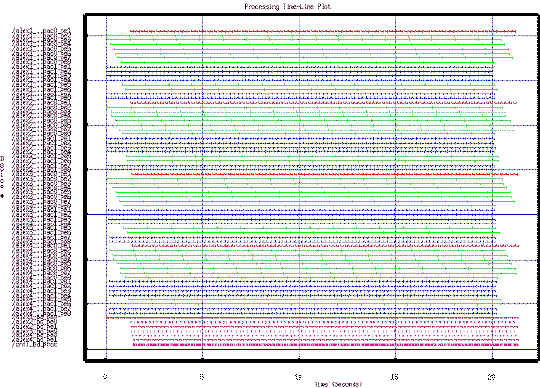
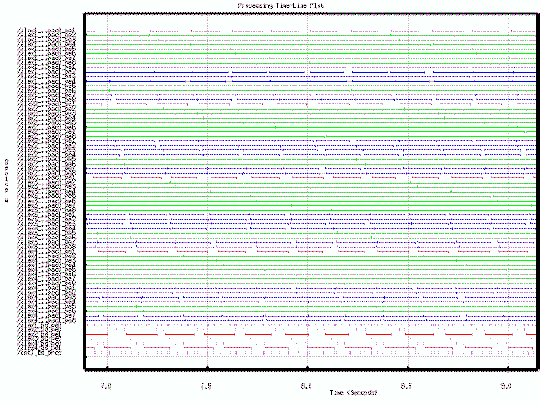
Figure 24 shows the simulation timing results of the four board VHDL system model. It shows that the system was highly utilized and could process the data at slightly less than the full rate of 30 chips per second. There were two main differences between this model and the Cosmos model. This model used a static scheduler based on predicted compute times and the task sequences. The scheduler assured that data was sent to the tasks before it was needed, resulting in the data transfers being overlapped with execution. This model also used random compute times for the LRC and HRC tasks. This can be seen in a blowup of the timing plot in Figure 25. The simulation was run with both fixed delays and random execution times. Over a simulation time of 20 seconds, the total processing increased by only 14 ms with the random execution. This showed the static scheduler was very robust and no significant system degradation would be encountered due to the random LRC and HRC processing times.
Modeling the SAIP system in VHDL provided a number of significant contributions. It verified that:
Some of the key characteristics of the Cosmos performance modeling tools are:
Key characteristics of the lightweight VHDL performance modeling tools are:
Since the BM4 performance modeling activity used both tools a comparison can be made about their capabilities and performance. Both tools were run under Solaris on a Sun Ultra-1 platform with 128 MB memory. Each tool used Mentor's QuickVHDL to compile and simulate the VHDL code. When using the Cosmos tool, modeling was limited to two Sharc boards due to the amount of memory required and the extended simulation times. As a result, the simulation comparisons are focused on the two board model development and simulation execution.
The primary effort with the Cosmos tool was development and debugging the software model. In the case of the lightweight VHDL model development the effort focused on the development and testing of the Sharc VHDL model. In each case the performance model development effort took over three weeks, but efforts were focused in different areas.
The modeling effort with the Cosmos tool was broken down as follows:
Total effort - - 3 weeks, 1 day.
The modeling effort using the lightweight VHDL tools broke down as follows:
Total effort - - 3 weeks, 2 days.
The following tables show the test cases that were run with the Cosmos and lightweight VHDL models and compares the simulation runs times and memory requirements:
Lightweight VHDL BM4 Modeling Description
To overcome the complexity and runtime limitations experienced with the Cosmos BM4 system model, a decision was made to make use of lightweight VHDL token level models to assemble the full BM4 system virtual prototype. As part of RASSP, ATL had demonstrated that lightweight VHDL modeling techniques were highly efficient for modeling and validating large complex multiprocessor systems. As a result, the BM4 system performance modeling activities were shifted to an effort to use these techniques to verify the BM4 four board hardware/software design.
SAIP System Modeling in VHDL
The SAIP BM4 VHDL performance modeling required a Sharc model with its six Sharclink ports. There was an existing Sharc model in our library, but the model did not use Sharclink messaging. The Alex board required that messages be sent from one Sharc to any other Sharc across multiple Sharclinks in a store-and-forward manner. This behavior required a change to the link port messaging definition. Another issue was the inability of the model to simulate the message routing and forwarding. This was solved by recording the number of messages routed through the processor while it was computing and adding a delay to account for time the processor needed to handle the message passing. The Sharc VHDL model was further refined by randomizing its timing behavior for LRC and HRC processing tasks to model the early termination variable execution times.
Comparison of Cosmos and ATL VHDL tools
Using two different performance modeling tools, Omniview's PMW/Cosmos V1.5.3 tool and ATL's VHDL library of reusable models, provided an opportunity to learn, compare and assess the differences between the tools. In the following paragraphs, the salient features, strengths and limitations of each tool will be described. In addition, since both tools were used to model the system a comparison of the memory and simulation times is discussed.