Next: 7 References Up: Appnotes Index Previous:5 Performance Modeling Method
![]()
![]()
![]()
![]()
Next: 7 References
Up: Appnotes Index
Previous:5 Performance Modeling Method
Software Description
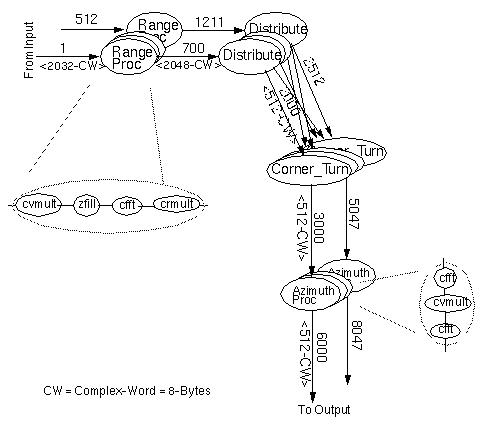
The data flow graph (DFG) of the SAR application is pictured in figure 6- 1 below.
The application DFG contains about 11,000 task nodes. The task nodes were assigned to processor elements (PEs) by partitioning the DFG into tightly-connected groups of nodes.
Hardware Description
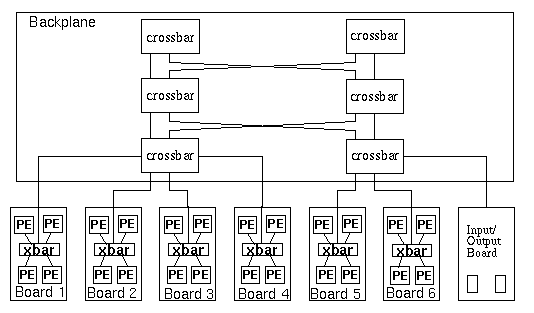
The processing system consisted of 24 Processor Elements (PEs) and multiple crossbar elements. Two candidate architectures were evaluated with the token-based performance models. The first was the Mercury-Raceway(TM) based network, figure 6- 2.
The second candidate architecture was a Scalable Coherent Interface (SCI) based network pictured in figure 6- 3. The Raceway network belongs to the multi-stage switch network architecture class, while the SCI is a ring network type.
Rapidly simulating a significant portion (5 - seconds) of the real-time application executing on the full multi-processor system required a much higher efficiency and modeling abstraction than that of the typical ISA-level model. To be abstract, yet accurate, only the necessary details were resolved in the model. These included significant protocol events such as initiation and completion of data transfers as well as significant computational events such as the beginnings and endings of bounded computational tasks. The resolved events focus around contention for computation and communication resources whose usage time, once allocated for a task or transfer, was highly deterministic. The simulation is valuable because the contention for the multiple resources is not conveniently predictable.
The nature of the SAR application implied a relatively large computational event granularity; on the order of thousands of clock-cycles. Similarly the RASSP design group found that resolving the communication events to the packet level accurately characterized the communication network performance.
The design the models of the Raceway communication network, began with a description of the communication protocol in a way that was as abstract as possible while still providing an accurate depiction of its resultant performance. The protocol was described by its significant events, which were the beginning and ending of packets.
To implement the protocols in VHDL, the abstract protocols were expressed as state transition diagrams. The state transition diagrams are conveniently converted to VHDL by means of a case statement on the state.
For more specific information on the VHDL code details, with excerpts of actual VHDL code, see VHDL detailed excerpts.
Results
The design group produced time-line graphs from the simulation results which showed the history of task executions on the PE's. The graphs were useful in helping to visualize and understand the impact of mapping options that led the design group to modify, optimize, and ultimately verify the partitioning, allocation, and scheduling of the software tasks onto the hardware elements. The time-line graphs showed the times when PE's were idle due to data starvation or buffer saturation that helped isolate other resource contentions and bottle-necks.
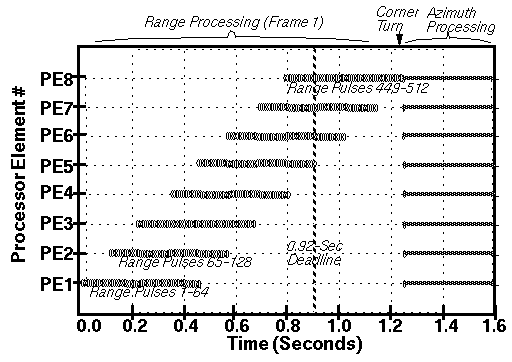
The processing time-line graph in figure 6 - 4 is an example of the kind of visual output obtained from token-based performance modeling.
To illustrate the usefulness of token-based performance modeling, the first graph shows a sub-optimal mapping of tasks
to processors. Notice that there is much idleness of the processors on the left half of the graph. This mapping resulted in
poor performance, as the processing deadlines were not met. Visualizing that initial time-line led to an alternative mapping
strategy that allocated processing tasks in a finer-grain round-robin style. The resulting processing time-line graph is
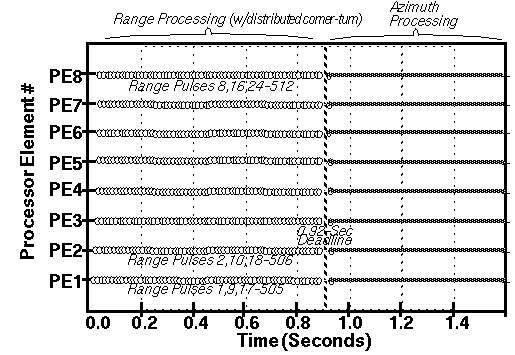
shown in figure 6 - 5 below.
To illustrate the usefulness of token-based performance modeling, the first graph shows a sub-optimal mapping of tasks
to processors. Notice that there is much idleness of the processors on the left half of the graph. This mapping resulted in
poor performance, as the processing deadlines were not met. Visualizing that initial time-line led to an alternative mapping
strategy that allocated processing tasks in a finer-grain round-robin style. The resulting processing time-line graph is
shown in figure 6 - 6 below.
Efficiency
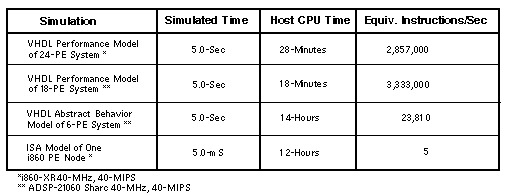
The VHDL performance simulation consumed 28 Sparc - 10 CPU minutes. This implies an equivalent instruction execution
rate of about 2.9 - million per second when considering the number of PEs and their individual instruction rates. The corresponding abstract-behavioral model consumed 14 CPU-hours and exhibited an effective execution rate of 23,810 instructions per second.
By comparison, a much more concrete model, such as an ISA-level VHDL model of the i860 PE, exhibited about 5.5 to 7.5 instructions-per-second on a Sparc - 10 CPU [6]. Such ISA models are more useful for understanding the behavior of software segments that dwell within a given PE.
Down-Stream Process
The resultant software task partitioning and schedules from the performance model led directly to the production of the target source code through a straight-forward translation into sub-routine calls.
Accuracy
When the physical SAR DSP system was built and loaded with the generated application software developed in the modeling process, the design group found that their simulations accurately predicted the system's actual run-time performance to within a few percent. The DSP system's processing throughput requirements were satisfied without further modification.
The time required to develop the VHDL Token-based performance model of the system was about 5 - weeks with two engineers. The total time consumed in the development activity was 371 - hours. About 1378 Source-Lines-Of-Code (SLOC) were generated for the models. Additionally, about 1657-SLOC were generated for the test-benches for verifying the correctness of the models and to assist in their development.
Future efforts should require much less time, as the original effort included significant learning-curve time for developing methods for describing performance models in VHDL as well as the time to develop all models from scratch. Subsequent projects are reusing the previously developed models with greatly reduced design time.
Model Library
The full versions of the actual VHDL models are obtainable from the following repository: ATL Performance Model Library.
6.0 Example: SAR System Application
The Digital Signal Processing (DSP) subsystem of a Synthetic Aperture Radar (SAR) system was modeled under the RASSP Benchmark - 2 project. The performance modeling was conducted by Lockheed Martin's Advanced Technology Laboratories (ATL) in VHDL for relatively seamless transition to the down-stream detailed design processes. The initial design risk assessment indicated the significant challenges involved integrating and coordinating the various hardware and software elements into a system of multiple cooperating PE's. In particular, the application's real-time operation presented the highest risk. Because the hardware and firmware elements were selected from COTS products, they effectively became validated by default. Therefore, the design team considered the simulation of the complete hardware-software multi-processor system to be more important than simulating the operation of an individual sub-section of the architecture.

![]()
![]()
![]()
![]()
Next: 7 References
Up: Appnotes Index
Previous:5 Performance Modeling Method