|
|
|
|
|

Running a simulation with Code Coverage
All commands are shown as entered on the ModelSim command line.
For this lesson, you'll use the same working directory used for the Simulating with the Performance Analyzer lesson. It is not necessary to recreate the work library if you completed the last lesson. See Lesson 10 - Simulating with the Performance Analyzer (10-77) if you need the details on these steps.
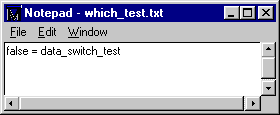
- Prior to running the simulation, we need to check the which_test.txt file in the modeltech\examples\profiler directory to ensure it reads "false = data_switch_test". You can edit the file with notepad within ModelSim.
notepad which_test.txt
This switch configures the test bench - the ringrtl.vhd file. We'll change it later in the lesson when we merge the coverage results of two simulations.
- Compile the lower level blocks of the design.
vcom control.vhd retrieve.vhd store.vhd
- Compile the top level block, test bench, and configuration files.
vcom ringrtl.vhd testring.vhd config_rtl.vhd
- Use the vsim -coverage command to load the design configuration with Code Coverage.
vsim -coverage work.test_bench_rtl- Run the simulator for 3 milliseconds.
run 3 ms- Display the coverage_summary window.
view_coverage(MENU: View > Other > Source Coverage)
The top half of the window shows summary information on a per-file basis. If you select a file in the list, the bottom part of the window gives details about the lines in the file that have zero coverage.
Note that both testring.vhd and control.vhd are below 90% and, therefore, shown in red in the Coverage bar graph. 90% is the default coverage threshold, and all coverage values below 90% will be shown red. The default coverage threshold can be changed with the Tcl control variable $PrefCoverage(cutoff).
- Click on the control.vhd pathname to display the source code for control.vhd in the Source window. With Code Coverage enabled, the Source window is displayed with an extra column that details the number of times each line has been executed. The green "Xs" in the graphic below denote lines that have been excluded. We'll discuss that later in the lesson.
Scroll the Source window to view the executable lines. As you can see some lines have red zeros next to them. This indicates a line that was not executed.
(MENU: Report > Save Line Coverage)
Open the file cover.dat to see how the data is stored. Notepad works well to check text files such as this.
notepad cover.dat
|
Model Technology Incorporated Voice: (503) 641-1340 Fax: (503)526-5410 www.model.com sales@model.com |
|
|
|
|
|