|
|
|
|
|

Speeding up the simulation
The information provided by the Performance Analyzer can be used to speed up the simulation. Double click the pathname for store.vhd:43 and retrieve.vhd:35 and view the source code. In both cases, the source includes a loop which could have an exit.
- Modify the loops to include exits inside the IF statements, or compile the following files included for that purpose - store_exit.vhd and retrieve_exit.vhd.
vcom retrieve_exit.vhd store_exit.vhd
- Compile the top level blocks and configuration files again to account for the lower level changes.
vcom ringrtl.vhd testring.vhd config_rtl.vhd
- Reset the simulation to time zero and restart with the modified files.
restart -f
Run time has been cut almost in half by inserting exits in the loops.
(MENU: View > Other > Hierarchical Profile)
A lot of time is still being spent in the loops. To further reduce simulation time, these loops can be replaced by indexing an array.
- Remove the loops and add an array, or compile the following files with the modifications already done.
vcom retrieve_array.vhd store_array.vhd
- Compile the top level blocks and configuration files again.
vcom ringrtl.vhd testring.vhd config_rtl.vhd
- Restart the simulation with the modified files.
restart -f
- Run timerun.do again and note the difference in simulation run time. Your simulation time may differ from that shown here, but the new run should be very fast - approximately ten times faster than the original simulation time.
do timerun.do
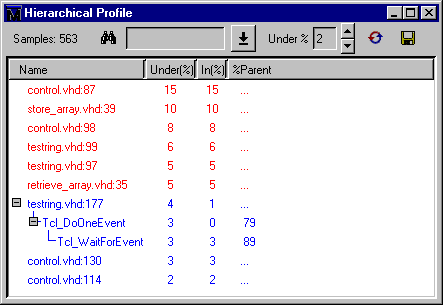
- Look, again, at the Hierarchical Profile of simulation performance and you will see more lines showing.
view_profile(MENU: View > Other > Hierarchical Profile)
- Set the Under% filter to "2" and click the Update icon. This will filter out all usage values below 2%.

- Take a look at the Ranked Profile view.
view_profile_ranked(MENU: View > Other > Ranked Profile)
- Use the report command to output a file with the profile data.
profile report -hierarchical -file hier.rpt -cutoff 4This command outputs a hierarchical profile of performance data with the file name hier.rpt.
|
Model Technology Incorporated Voice: (503) 641-1340 Fax: (503)526-5410 www.model.com sales@model.com |
|
|
|
|
|